I'm a big fan of business metrics dashboards. A couple of months ago I put together a digital dashboard that is displayed on a large TV screen in the office.
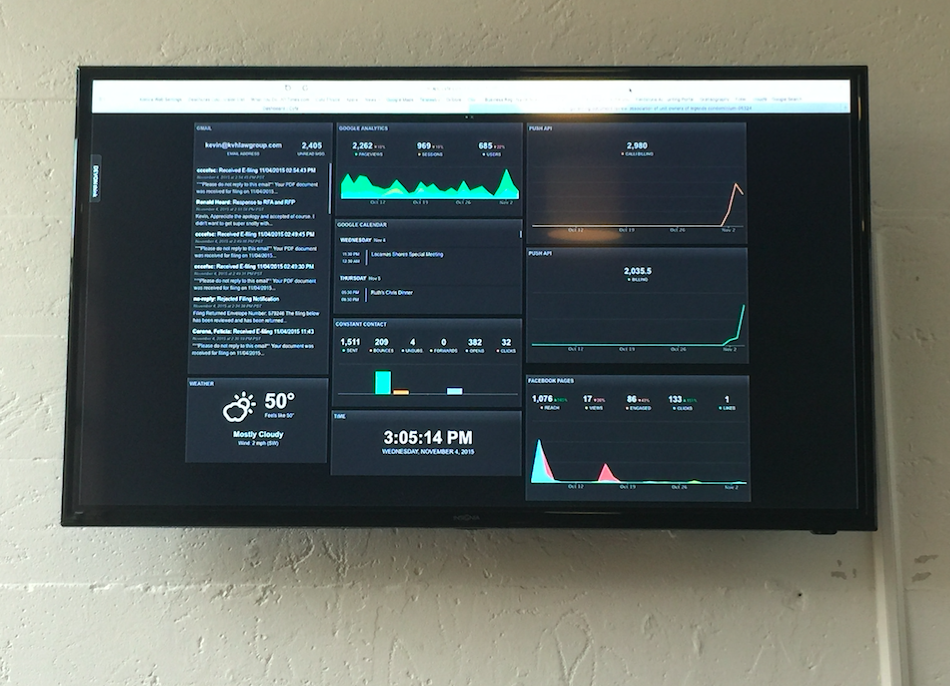
The dashboard displays the following information:
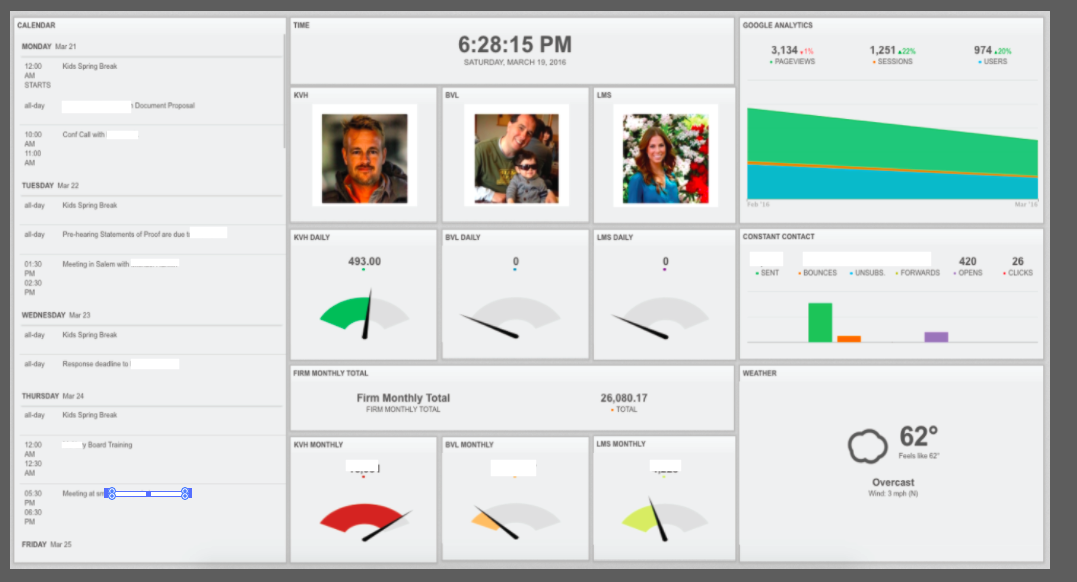
- Weekly calendar and appointments;
- Daily amount billed by each firm member;
- Monthly amount billed by each firm member;
- Total amount of monthly billings;
- Google analytics data from firm website;
- Constant contact email marketing data;
- Time & weather.
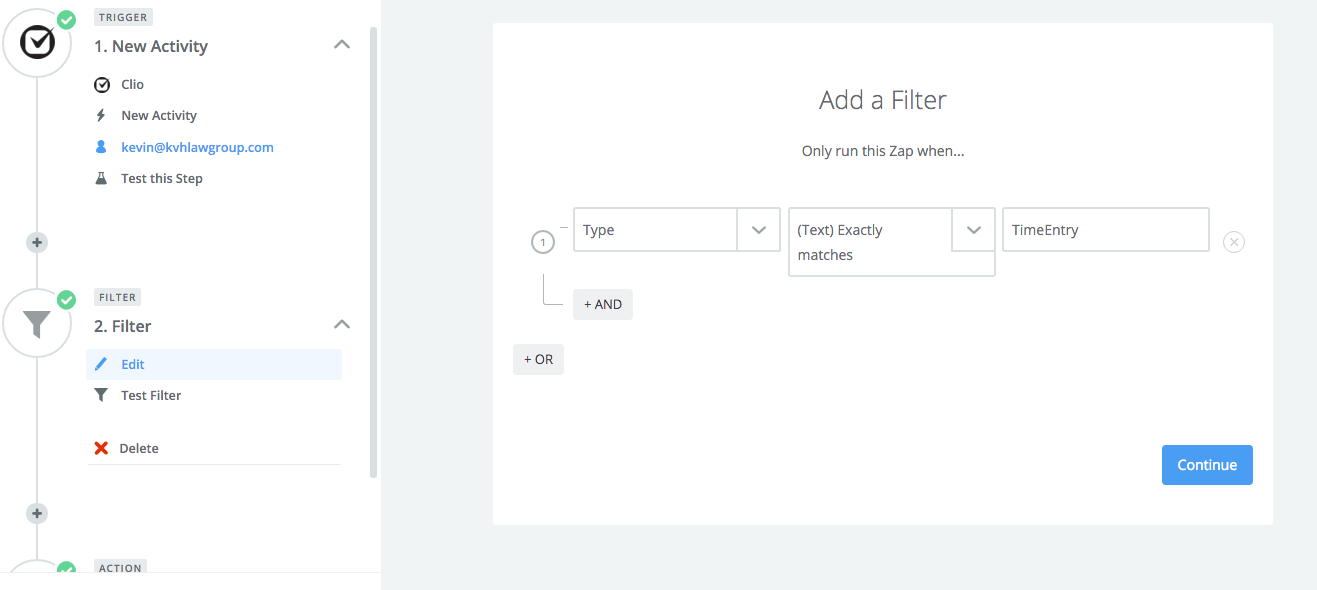
Our firm uses Clio for our law practice management, including contacts, documents, billing, and time keeping. Because Clio has an API, you can access your data however you'd like. I'm not much of a programmer, though, so I use Zapier to pull data from Clio. Using Zapier, each time a firm user creates a time entry, that data goes to a private Google Spreadsheet:
Once the data is in Google Sheets, you can display the information in a variety of ways on a dashboard. I use Cyfe, which has dozens of "widgets" to connect to your data.
Here's a look at the current dashboard design: